
Spatial Data Toolkit – Under the Hood
Here’s a closer look at the Spatial Data Toolkit and a quick example of how it works.
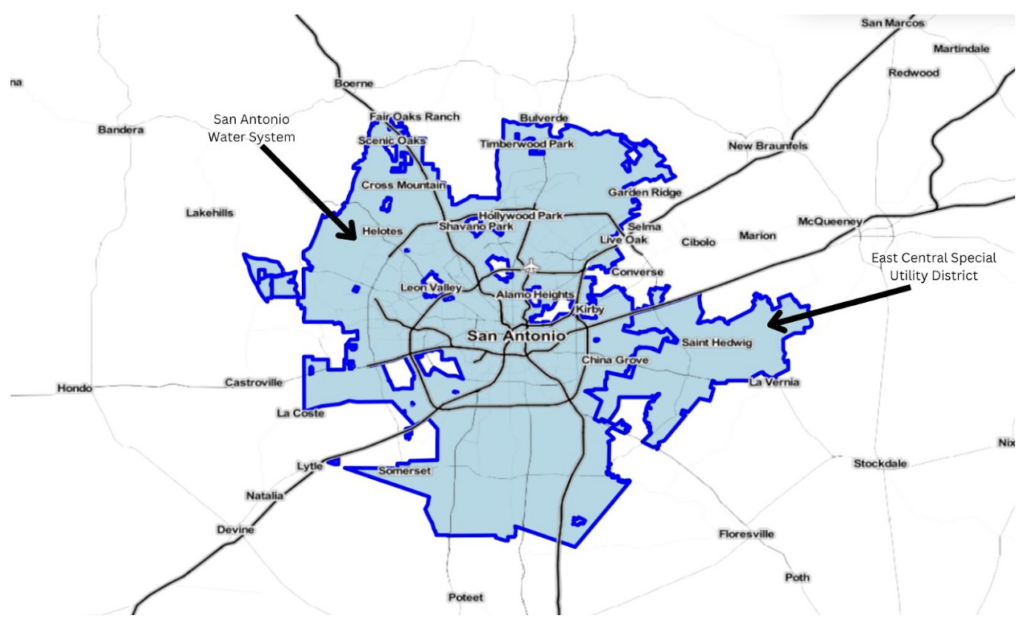
To provide more accurate, geocoded demographic data for a specific region, the Spatial Data Toolkit takes in two shapefiles and calculates the extent to which their coordinates overlap. It can then extract and aggregate data from one shapefile to the other based on the resulting intersection between the geographies. New insights can then be gleaned from analysis conducted at the desired level of geographic granularity. For example, Map A shows communities served by two different water utility companies.
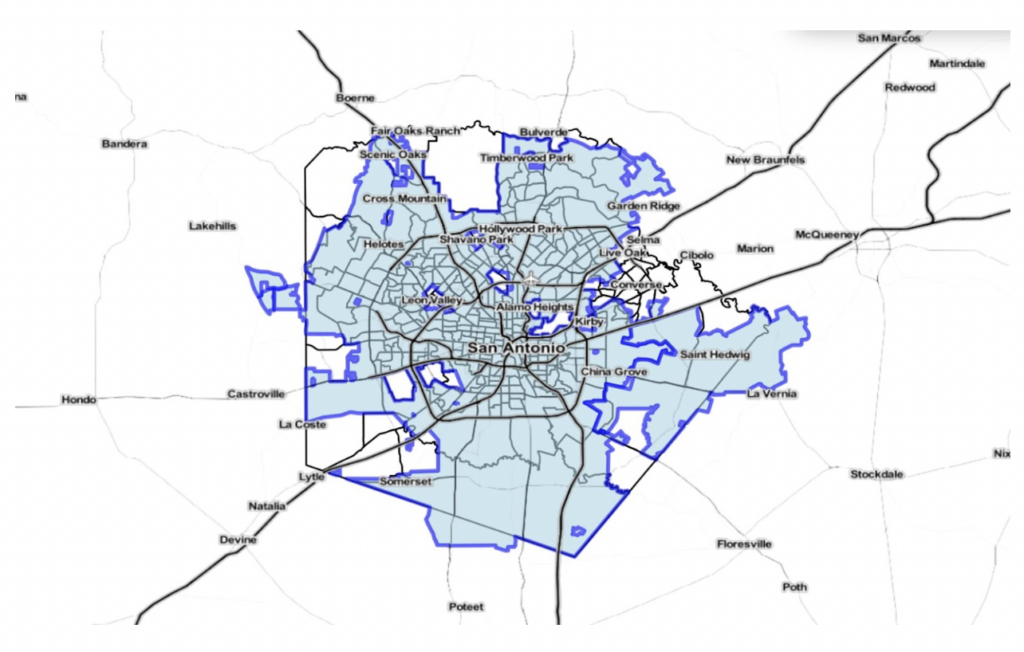
Community water system geospatial data is messy, with boundaries that don’t fit intuitively with census or municipal data. If the goal is to direct funding to the most underserved neighborhoods facing the brunt of water quality issues (i.e., lead pipes), it is crucial to first understand which communities these water systems serve. Thus, demographic and socio-economic data must be extrapolated from an overlapping shapefile, such as geospatial census data, as shown below in Map B, where census tracts are overlaid the community water systems.
The Spatial Data Toolkit efficiently queries both the census and water system shapefiles for polygons that may overlap, and then calculates the area of intersection and subsequent percentage of overlap for each intersecting pair. Finally, it aggregates the census data from each intersecting census tract into a weighted average value for each water system.
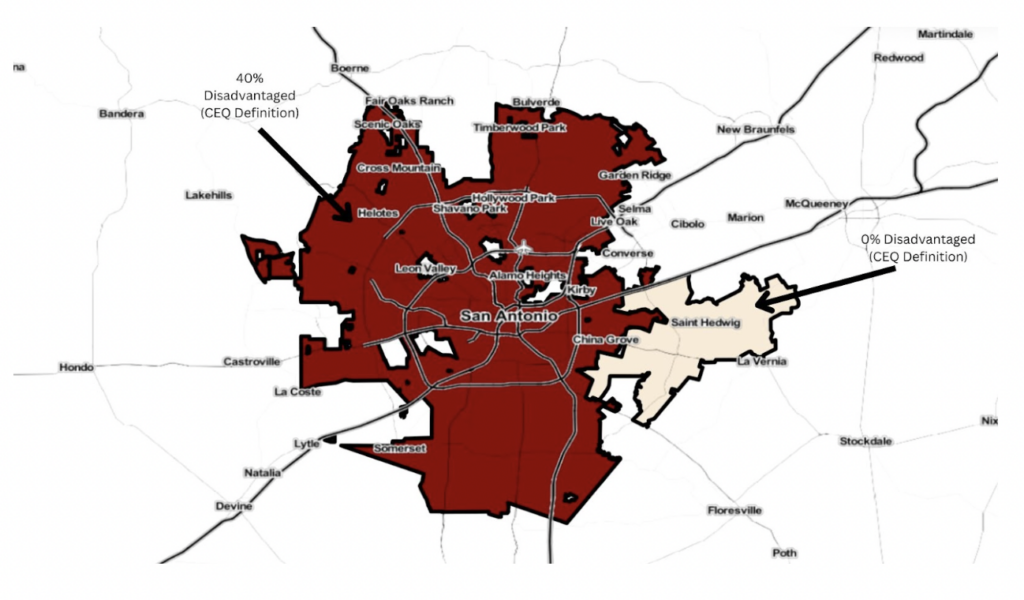
As a result, it is then possible to aggregate and analyze data at the community water system level. In this example, if one is using the Justice 40 Initiative indicator for Disadvantaged communities, which exists at the census tract level, the Spatial Data Toolkit allows users to easily identify water systems serving Disadvantaged communities based on the aggregated overlap with underlying census tracts, as depicted in Map C.
Because this Spatial Data Toolkit is flexible enough to work between any two shapefiles, this analysis combining water systems, census tracts, and Justice 40 data is only one simple sample of how these methods can be applied.
To explore other example use cases, visit:
- Green Jobs and the Redistricting Problem using Spatial Data Aggregation
- Leveraging Spatial Data to Identify Communities in Need of Safe Drinking Water Funding
Written by Phil Cork and Elise Rust