
Green Jobs and the Redistricting Problem using Spatial Data Aggregation
The Massive Data Institute’s Environmental Impact Data Collaborative is working alongside Dream.Org’s Green For All program to build an inclusive green economy and provide data-driven analysis to legislators to encourage their support on climate policy. A key element of this work is providing evidence of the economic importance of jobs with positive environmental or climate impacts, or green jobs. Reliable, contemporary data on the prevalence of green jobs are not provided by the U.S. government—despite the fact that such evidence could be a powerful political lever to motivate legislators’ support of climate policy, especially in swing states. To provide such data, my research has generated current estimates of Green Employment at the congressional and state district level for California by employing MDI’s novel Spatial Data Toolkit to extrapolate existing data across new geographic boundaries.
Between 2010 – 2013, the primary source of data on Green Jobs was the Bureau of Labor Statistics. Data collected for President Obama’s Green Jobs Measurement Program offers a historical baseline on green jobs totals and the industrial/occupational/geographic distribution of green jobs. However, funding for the Green Jobs Measurement Program was cut in October 2013 due to budget constraints; thus, current estimates of Green Jobs potential must be estimated using county level employment data from the Census’ County Business Patterns (CBP) survey. This can then be spatially aggregated, using MDI’s Spatial Data Toolkit, to the congressional/state district geography where decision making is happening.
County-level estimates are calculated by cross-referencing annual county-level employment data (broken down by subsector) against the proportion of a subsector that is actually employed in a GGS. Assuming that Green Goods and Services have seen a linear growth rate, then up-to-date GGS percentages can be calculated and applied to 2022 data. Relying on 2010 estimates of subsector green jobs percentages likely underestimates county-wide green job employment, especially since it is still unclear how defensible the linear growth rate assumption is. However, until more recent subsector percentages are gathered on the ground, this methodology offers a starting point for analysis and further research.
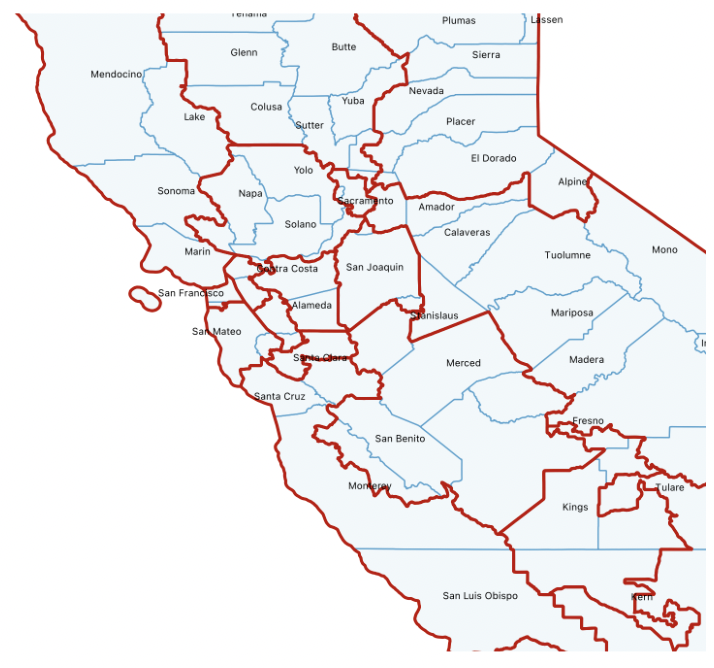
To bridge the gap between these county-level estimates and legislative district estimate and to connect constituents with the legislators who can best impact their economic growth and environmental protection, Phil Cork and I developed a custom tool called the Spatial Realignment Algorithm. This tool can split up a county’s population and associated demographic, socioeconomic, and Green Jobs data into the respective congressional districts they most overlap with. Map 1 below illustrates California’s counties overlaid with the state’s congressional districts to display the spatial disconnect between the two layers.
Map 1: The Spatial Misalignment Problem
(California State Legislative Districts Overlaid on California Counties)
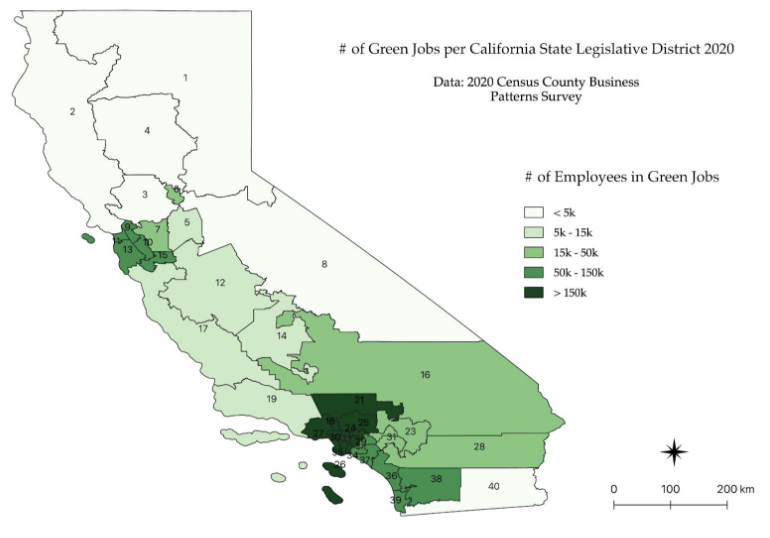
Using the Spatial Realignment Tool, I estimate that California had 960,186 Green Jobs in 2020 when looking only at direct Green Jobs such as those in the solar industry or in climate change research. These industries can more defensibly be categorized as wholly contributing to a green economy, because the whole industry produces goods and services that benefit the environment and conserve natural resources. Los Angeles County and Santa Clara County host almost 40% of California’s Direct Green Jobs. Aggregating up to federal congressional districts, we see that districts 11, 17, 29 hosted the most Green Jobs and were represented by Mark DeSaulnier (D), Ro Khanna (D), and Tony Cárdenas (D), respectively. Map 2 illustrates direct GGS in 2020 state legislative district boundaries.
Map 2: Direct GGS in 2020 state legislative district boundaries.
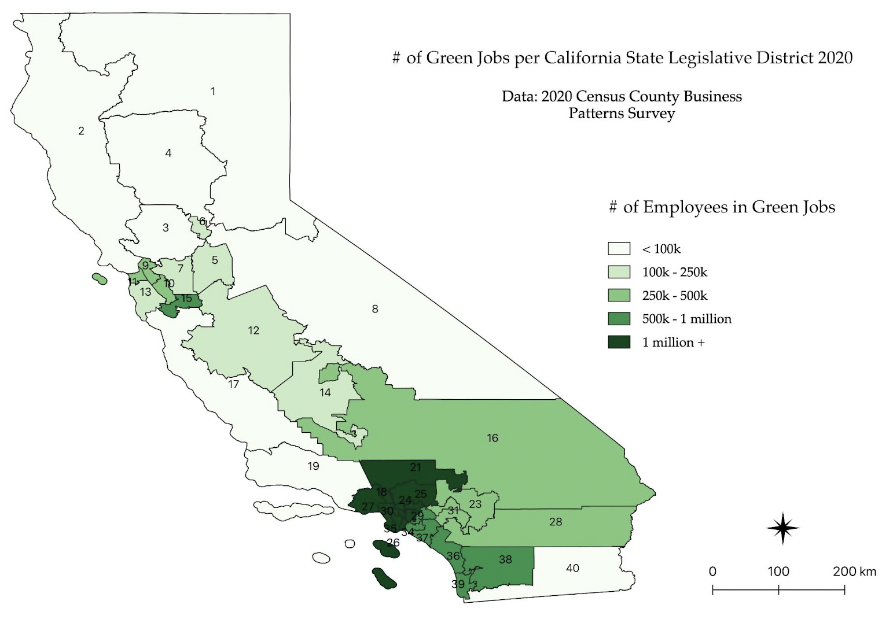
This analysis also expanded the scope of Green Jobs to examine direct AND indirect Green Jobs such as manufacturing of electric light bulbs. The broad umbrella of “Green Jobs Potential” provides a liberal estimate that ioptimal for estimating the maximum impact of climate change legislation, or estimating the potential for more GGS in industries more sensitive to the economics of climate change. Via this method, I estimate that California had ~6 million Potential Green Jobs in 2020 with Los Angeles County and Santa Clara County hosting 36% of them. Aggregating up to federal congressional districts, we see that districts 17, 29, and 50 hosted the most Green Jobs and were represented by Ro Khanna (D), Tony Cárdenas (D), and Darrell Issa (R), respectively. Map 3 illustrates indirect GGS in 2020 state legislative district boundaries.
Map 3: Indirect GGS in 2020 state legislative district boundaries.
Calculating and aggregating data on employment in green sectors has become significantly more difficult since funding was cut for the BLS’s Green Jobs Measurement Program. Our research used rough methods to estimate green jobs potential at the congressional and state district levels. These methods assume that subsector percentages of Green Goods and Services from 2010 are a valid proxy for current day percentages, which is an assumption worth investigating more thoroughly. Further research in this space may expand the analysis to different states, especially swing states in the South and Southwestern parts of the country, and overlaying relevant socioeconomic and demographic data to understand which communities are being included in the growth of a green economy.
Written by Elise Rust