

Investigating Racial Disparities in Drug Arrests
Some argue the racial disparity in drug arrests is due to disproportionate drug use – what does the data say?
As an MDI Scholar, working in partnership with Justice Innovation Lab (JIL), I helped investigate racial disparities in drug arrests. In prior research on a medium-sized jurisdiction, JIL found that Black men are approximately six times more likely to be arrested for drug-related offenses than White men. One argument for the disparity is that drug offenses are committed in proportion to the number of arrests. For this to be true, Black men would have to use drugs disproportionately more than White men. But what does the data say?
Our research focused on producing estimates of drug use by race. The process required geocoding arrest locations from high-quality administrative data as well as implementing cutting-edge machine learning methods to predict drug use. In general, our findings suggest that patterns in drug arrests do not match the estimated patterns in predicted drug use. In particular, we find that while Black men are more likely to be arrested for drug crimes, they are less likely to use drugs. Specifically, Black men are 10% less likely to be predicted to use drugs than White men. Further, we identify that the racial composition of a neighborhood is more correlated with drug arrests than drug use. This research furthers both the Justice Innovation Lab’s mission of identifying unfair practices in the legal justice system and developing effective alternative solutions as well as the Massive Data Institute’s mission to harness data to conduct cutting-edge research and improve the policy decision-making process.
Working with messy, imperfect data in a real-world setting as part of a team served as a great opportunity to apply classroom lessons to practical applications. As a researcher on this project, I geocoded arrest data, harmonized various data sources to train and test the machine learning model, and created an interactive dashboard to evaluate the model’s predicted outcomes. This process allowed our team to compare the average frequency of arrests and average predicted drug use in light of the demographic features of each census block group (essentially neighborhoods, for example, there were four block groups in this jurisdiction).
To determine predicted drug use at the individual level, we trained our model on a subset of results from the National Survey of Drug Use and Health and recorded predicted outcomes for the anonymous individuals in the Census PUMS dataset, which provides individual-level census data for a random representative sample of respondents. I then developed an interactive dashboard that allows users to explore the model’s predictions applied to a small sample of the full data. Through this tool, we were able to better understand trends within the individual-level dataset such as how predicted drug use changes over time or across different categorical features. The dashboard also helped validate our findings and verified the representativeness of our datasets.
With drug use predicted at the individual level, our team then turned to considering trends at the census block group level. By geocoding the drug arrest data, I transformed street addresses into coordinates and placed each in a census block group. We then assigned each individual to a representative block group using synthetic population data constructed by RTI. These two processes allowed us to compare average drug arrests and average drug use at the block group level using proportionately representative population estimates. Finally, we modeled each census block group’s features to evaluate the relationships between drug use, drug arrests, and race, as depicted below.
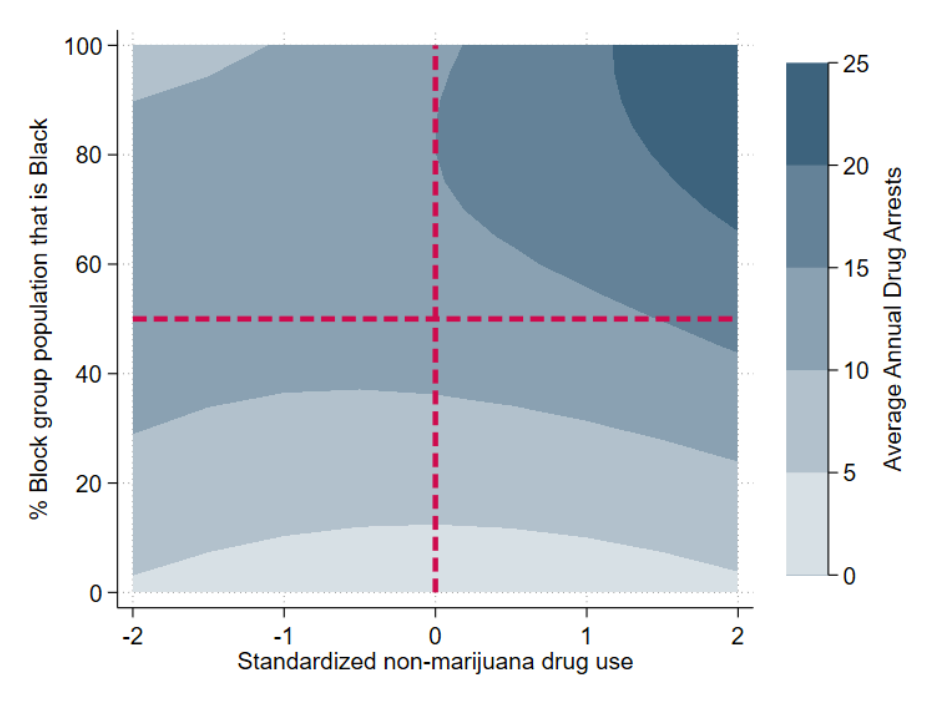
Heatmap comparing census block group racial features, standardized drug use, and average annual drug arrests
This heatmap, produced by our model, helps us better understand the multifaceted relationship between race, drug arrests, and drug use. In particular, we observe three key trends. First, for predominantly White block groups (those along the bottom of the graph), standardized drug use does not correlate with the average annual drug arrests, as seen by the mostly uniform color gradient. In contrast, if drug use and drug arrests were more correlated, we would see strict vertical bands denoting drug arrests increasing with drug use. Second, as we move along the y-axis vertically, we observe the average number of arrests increases as block groups become less White, regardless of predicted drug use, as noted by the horizontal bands of color. Finally, as both predicted drug use and the percentage of a block group that is Black increases, the average number of arrests increases more dramatically.
Thus, it becomes increasingly difficult to reconcile the assumption that racial disparities in arrests are purely driven by disparities in drug use with what we see in the data. Rather, the racial composition of a neighborhood appears more correlated with drug arrests than drug use.
More details about the methodology, model performance metrics, and results can be found on the poster I presented at the MDI Showcase event this spring and by exploring the interactive dashboard I developed.
Through this role, I’ve not only grown more proficient in coding in Python and learned how to work with geospatial and census data, but gained invaluable experience collaborating in mission-oriented organizations leveraging data to improve policy outcomes. Being an MDI Scholar not only provided these new skills that I’ve already applied to other projects but also introduced me to colleagues who became invaluable mentors over the course of the semester. This opportunity has been a crucial addition to my graduate studies experience.
Written by Phil Cork
- Tagged
- racial justice