
What We Learned From Evaluating Drinking Water Funding & Why It’s Currently Too Hard to Effectively Track
America is set to invest over $50 billion in water infrastructure funding over the next five years through the Infrastructure Investment and Jobs Act (IIJA), including $15 billion for replacing lead service lines. The US EPA’s DWSRF represent the primary mechanism through which the funds will be disbursed. EPIC and our partners set out to understand how well states are set up to prioritize and track which communities are utilizing these funds to quickly and equitably replace lead pipes. We found that we will not be able to effectively evaluate Justice40 and lead pipe replacement goals without far better digital infrastructure, data, and utilization of that data in prioritizing investments.
Let me explain.
The EPA allocates drinking water infrastructure funding to each state through Drinking Water State Revolving Funds (DWSRFs), and each state assigns funds to drinking water projects according to their Intended Use Plans (IUPs), or how they are planning to use their allocated funds for that year. Project Priority Lists (PPLs), or the projects that are priority to be funded each year, are added to the IUPs as an appendix. Analyzing these PPLs is crucial to identify where funds are going and who is set to receive them. As a Data Scholar at Georgetown University’s Massive Data Institute, I evaluated robustness and standardization of information from PPLs across the states, and reviewed how many projects were earmarked for lead pipe replacement between 2020 and 2021, which is prior to the funding available from IIJA.
This blog will dive into the technical challenges I encountered with respect to how this data is captured, shared, and made easily accessible to evaluate. (Stay tuned for further updates on our project to track funding for lead service line replacement through SRFs in the coming months!)
What did I learn?

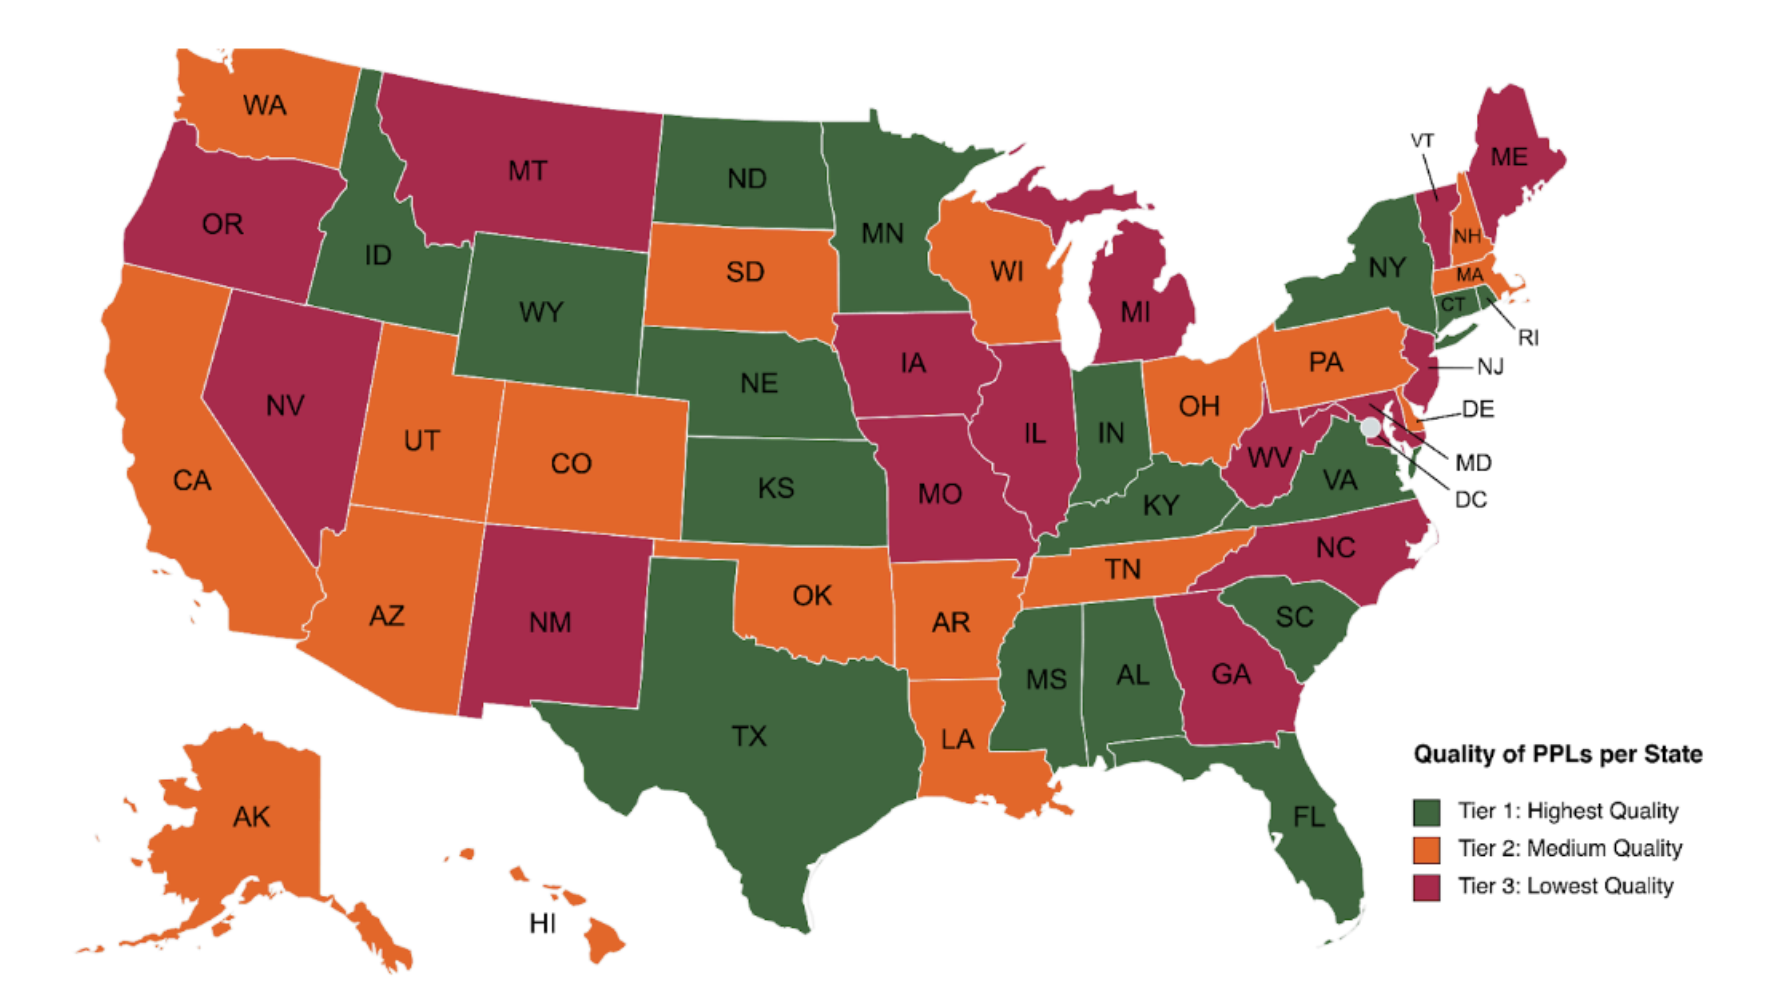
Quality of PPLs per state for machine-readability and robustness of data related to lead pipe replacements. To see the full categorization per state, see our spreadsheet here.
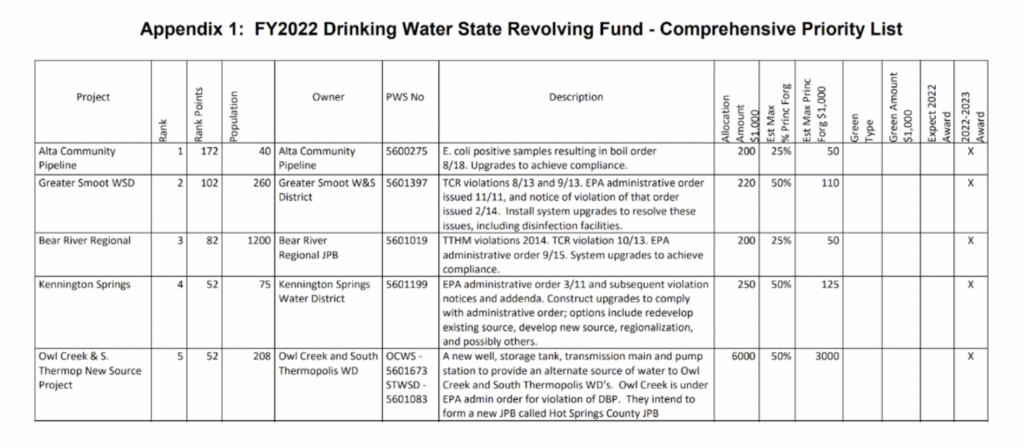
Unfortunately, some states will directly scan in their PPL tables, and this carbon copy-style paper reporting that meets yesterday’s transparency standards misses many opportunities to more easily evaluate and track where money is being spent today. Almost every state publishes PPLs as PDFs on websites that are difficult to navigate and in a format that is not usable by most data analysis tools – even for researchers that specialize in evaluating this type of data. So, we wanted to dive in and understand how to make this information more accessible to increase our understanding of who is actually benefiting from investments in water infrastructure. Following this analysis, here are some lessons learned to improve data accessibility and tracking of water infrastructure spending for the entire PPL:
- States currently publish all Project Priority Lists as PDFs – sharing them as data tables in CSV or XLSX files would make it easier for data to be analyzed and collated into a central national repository for easier access and evaluation.
- There is currently no standardized baseline set of variable names that are consistent across all state PPLs. Forums like the Environmental Council of the States (ECOS), USEPA, and ASDWA could all be good outlets for setting such standards, and then states could easily add additional variables as helpful to their respective programs.
- For lead pipe replacement and other investments, utilities should flag related projects in the project descriptions, or in a separate column of the PPL. (Note: We saw a few states starting to create separate tables for lead in FY2023, and I’d encourage others to do the same!)
Let’s dive into the details.
For this analysis, we collated 50 states’ PPLs and evaluated all the columns and robustness of data across the varying PPLs. From there, we established a baseline set of variables that were comparable across all states to analyze funding specific to lead pipe replacement. Because of extreme variability across states, we established three tiers of state data quality that could be used for the analysis based on:
- Overall quality of the data: How many fields were included within the PPL? How many of the fields were completed? (e.g. Were there unique identifiers for each water system?)
- Ease of evaluating the information: Was the information provided as a table within the PDF? Was the PDF machine readable?
- Robustness of the data: Did the PPL provide additional data that is useful? How much detail was provided about proposed projects? (e.g. median household income, disadvantaged status, “green” projects, did the project descriptions mention lead, etc.)
From this preparatory work, we realized that with the current state of the data, we were not able to evaluate funding specific to lead pipe replacement across all 50 states. This further illuminated the importance of data standardization and sharing information in an easily machine readable format.
The state of the states.
There are some states that have high quality data and provide a wide array of indicators and metrics about the projects and communities they serve – we call these Tier 1. They further include a unique identifier for the water system (PWSIDs), thoroughly detailed descriptions about how the funding will be used, and many contain specific information about lead funding projects. This includes the following 17 states: Alabama, Connecticut, Florida, Idaho, Indiana, Kansas, Kentucky, Minnesota, Mississippi, Nebraska, New York, North Dakota, Rhode Island, South Carolina, Texas, Virginia, and Wyoming.
Secondly, there are several states that are Tier 2, meaning they include much less detailed descriptions and fewer indicators or metrics, though they do provide the data in a more easily accessible format for analysis. These include the following 19 states: Alaska, Arizona, Arkansas, California, Colorado, Delaware, Hawaii, Louisiana, Massachusetts, New Hampshire, Ohio, Oklahoma, Pennsylvania, Puerto Rico, South Dakota, Tennessee, Utah, Washington, and Wisconsin.
Lastly, the remaining states post their information in formats that are very difficult to parse, and most fail to provide any descriptions and/or PWSIDs – these are Tier 3 states. These include the following 15 states: Georgia, Illinois, Iowa, Maine, Maryland, Michigan, Missouri, Montana, Nevada, New Jersey, New Mexico, North Carolina, Oregon, Vermont, and West Virginia.
The Importance of Publishing CSVs
Although premium software like Adobe Acrobat can automate the task of extracting information from a PDF reasonably well, it can be prohibitively expensive for many who want to examine this issue. At MDI, we developed a script using Python that downloads PPLs from state government websites and converts them into CSV files. While useful for this first analysis, this workaround would require modification each year as states will likely alter their publishing format. It is also a barrier to entry for most who do not have coding experience in Python. Some states fail to even publish the information in a table which makes it extremely difficult to parse the information for cross-comparison with other states (see Pennsylvania’s 2021 Project Priority List as an example).
The script had to be extensively altered to draw the information and convert it into a usable format. Further, if Pennsylvania alters this format at all in future years, the script will have to be carefully modified. If all states instead were to publish the CSV or Excel form of their PPLs, the information would be much more accessible and usable by anyone wishing to examine where SRFs are allocated in a given state.
The Importance of Standardizing Variables
Another obstacle in evaluating this data is the inconsistent naming of variables by different states. My approach to this issue was to synthesize each state’s PPL into one unified spreadsheet using a script in R. To do so, we had to evaluate all state columns and then choose standardized variables based on those with different names, but the same meaning – for example, “PWS_ID” and “PWSID.” We further had to manually rename certain columns that had identical names but different meanings – for example, “Name” could signify water district names in some states and project names in others. Because of the significant variety in variable names from state to state, our code for this work will require extensive changes if a state alters their variable list, and once again, it is only of use to those familiar with R.
It would be far more accessible for policymakers, researchers, community advocates, and others if the EPA required each state to use the same nomenclature for variables, even if some states use variables that others do not. Even setting a standard spelling for universal categories like “Project Name” and “Funds Requested” would make the data significantly easier for users to evaluate. Some suggested terms are listed below:
- PWSID: Public water system identification number
- Water System: The name of the water system that the project will serve
- Project Name: The title of the project to which the funds are being directed
- Project Description: Details that elaborate on the Project Name
- Funding Amount: The total number of dollars (in 1 dollar units) given to the project by the state
- Population Served: The number of people affected by the project
- Project Priority Points: The number of points awarded to the project based on whatever a given state’s metrics are
There are other terms that would be useful to standardize and unanimously include across states, such as disadvantaged status, principal forgiveness, and household income. Including such variables would increase transparency about the communities to which funding is directed and enable easier tracking of Justice40 and lead pipe replacement goals.