
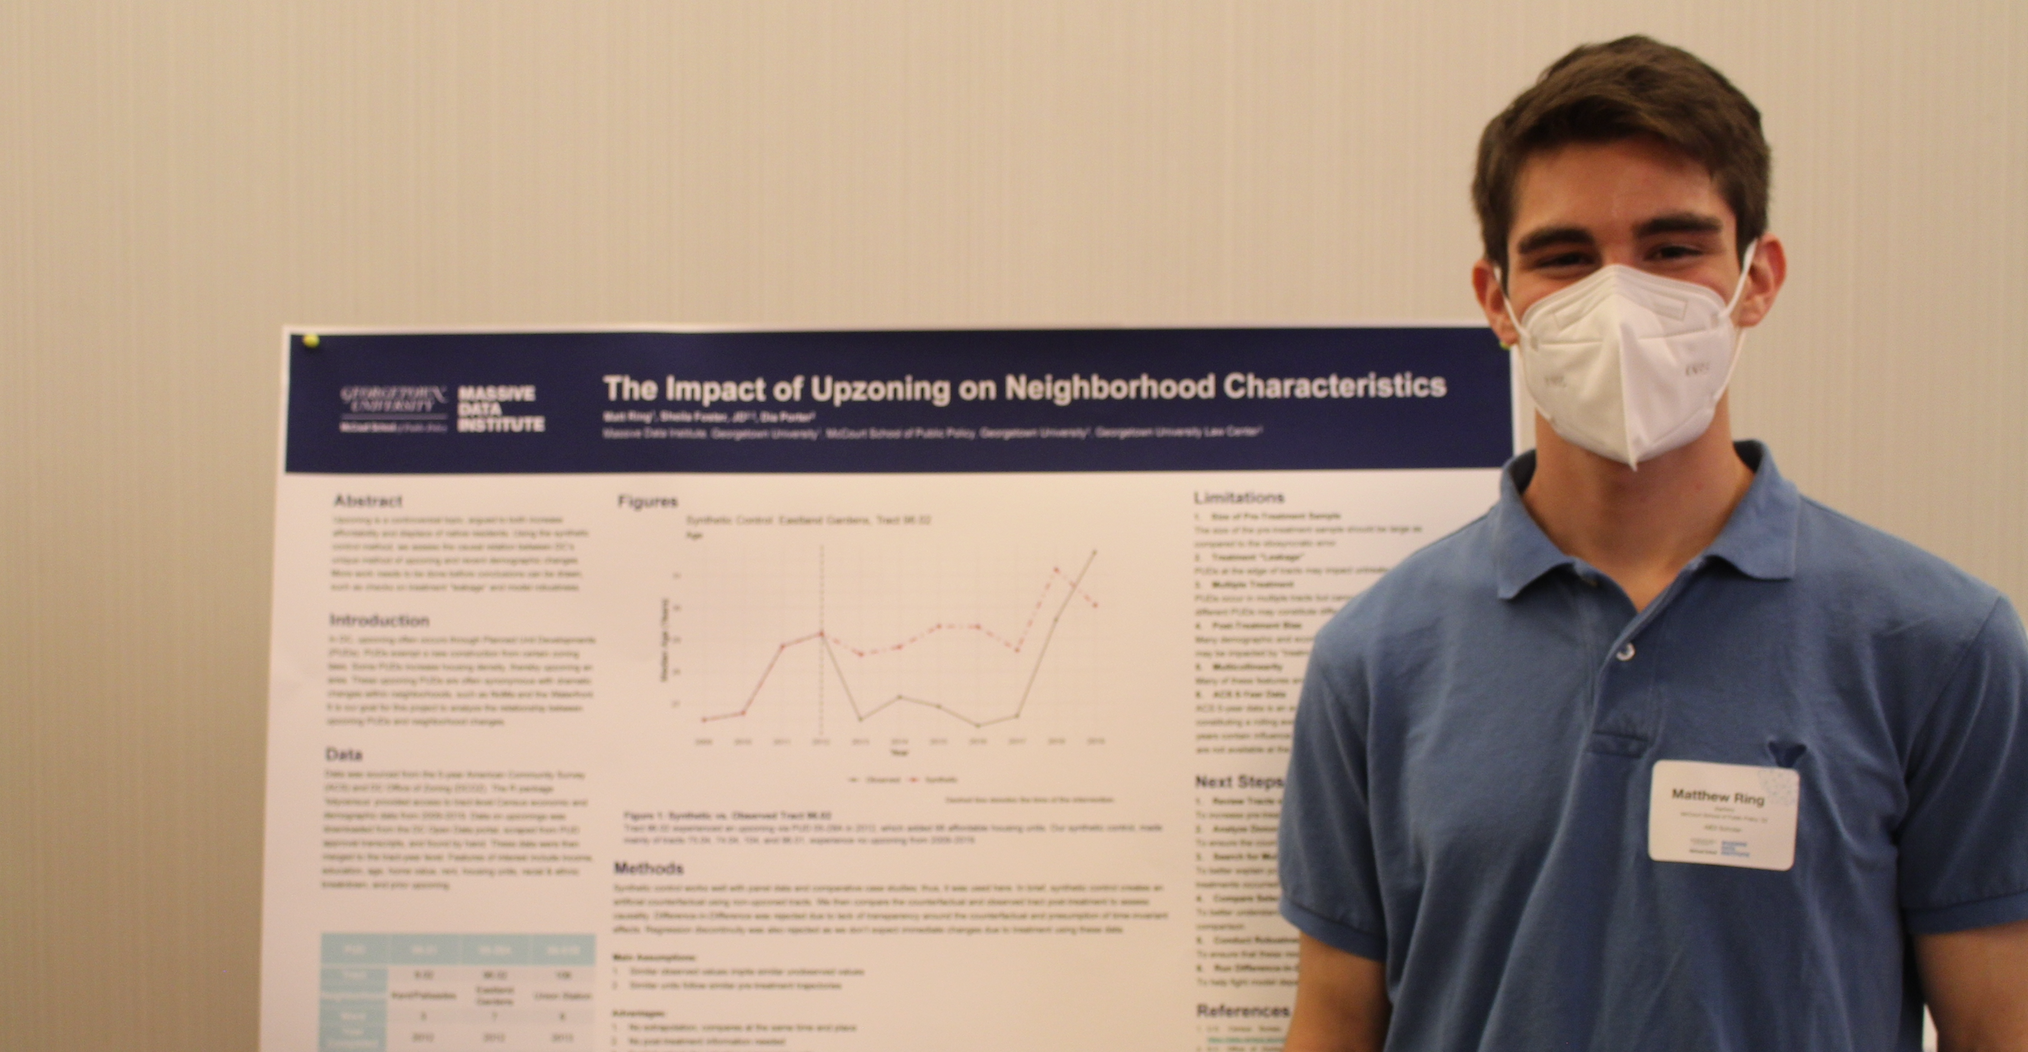
How Upzoning Changes DC Neighborhoods
Upzoning increases the amount of housing in a neighborhood, but what else might change?
Upzoning, legally allowing taller and more dense buildings, is a controversial topic argued to both increase affordability and displace native residents. DC’s Office of Zoning approves Planned Unit Developments (PUDs), which allow developers to ignore certain zoning regulations such as limits on housing density. Many PUDs have been concentrated in specific neighborhoods, such as the North of Massachusetts Ave (NoMa) neighborhood. By definition, these PUDs change the physical dimensions of neighborhoods. What’s less clear is how they impact characteristics like demographics, income, and rent. Based on prior research and the lived experiences of residents in DC neighborhoods experiencing upzoning, we expected PUDs to have some impact on features such as race, ethnicity, age, education, rent, and income.
In my research with my advisor Dr. Sheila Foster and Dia Porter, I scraped DC Office of Zoning meeting transcripts, merged geographies, and created visualizations to understand the impact of PUDs in DC. This helped us better understand when PUDs were completed, how PUDs were positioned within Census-defined regions known as tracts, and how neighborhoods were changing over time. During this process, I created an interactive map of Census and DC geographies that allows one to explore where PUDs are located, DC’s zoning regions, and Census tracts all in relation to one another; the data visualization can be found here.
In addition, in my research we explored the relationship between upzoing and neighborhood characteristics. The dataset I created was at a tract-year level from 2009-2019 for all of DC and included Census variables such as race and rent. Information describing if, when, and how much of a Census tract was upzoned by a PUD were also included.
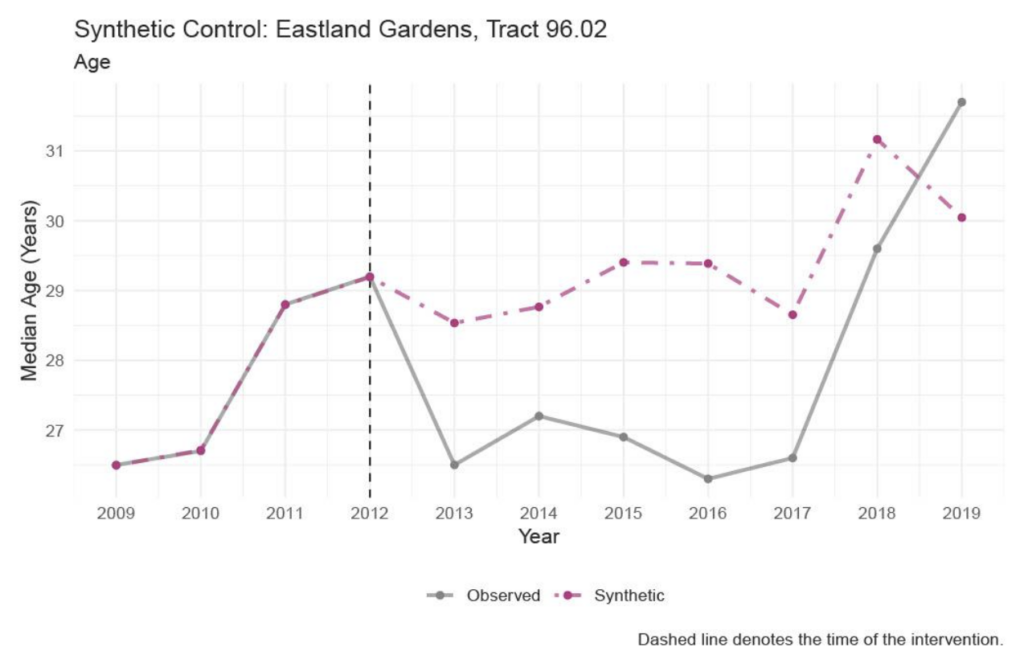
Synthetic control was used to create artificial Census tracts that show what a neighborhood might have looked like without being upzoned. This “synthetic” tract is made using proportions of other Census tracts similar to the one that was upzoned. This method fits comparative case studies like ours well, as it provides a synthetic counterfactual created using explicit criteria as opposed to requiring one subjectively pick similar Census tracts.
You can see how one such synthetic tract compares to the actual in the figure below. Note how the tracts split after the PUD was completed, indicating that the upzoning decreased the median age of that tract. This preliminary finding implies that allowing for more dense, affordable housing in Ward 7 attracted individuals younger than native residents, thereby changing the demographic makeup of the neighborhood. For more on the results of this project, check out this poster I presented at the MDI Scholars Research Showcase in May 2022.
My time as an MDI scholar working on this project helped me develop both as a data scientist and as a professional broadly, since prior to this experience, I’d never worked as the primary quantitative researcher on any project. This was the first time it was up to me to make important decisions regarding research design and methodology. The experience I’ve gained independently making important decisions has been invaluable.
Written by Matt Ring, MDI Scholar